> ## Documentation Index
> Fetch the complete documentation index at: https://help-loyalife.xoxoday.com/llms.txt
> Use this file to discover all available pages before exploring further.
# Reports & Analytics overview
> Measure and analyze your loyalty program's performance across transactions, members, communications, and custom SQL-based exports.
The Reports & Analytics module gives you the data infrastructure to evaluate, optimise, and audit your loyalty program. Access pre-built dashboards for instant insights, run custom SQL queries for tailored analysis, schedule recurring exports, and download data for offline processing.
## Accessing reports
Select **Reports & Analytics** from the left sidebar. The module is organised into two areas:
| Area | Purpose |
| ---------------- | -------------------------------------------------------------------------- |
| **Data Exports** | Generate, schedule, and download report files across all report categories |
| **Dashboards** | Real-time visual summaries of key program metrics |
 ## Report categories
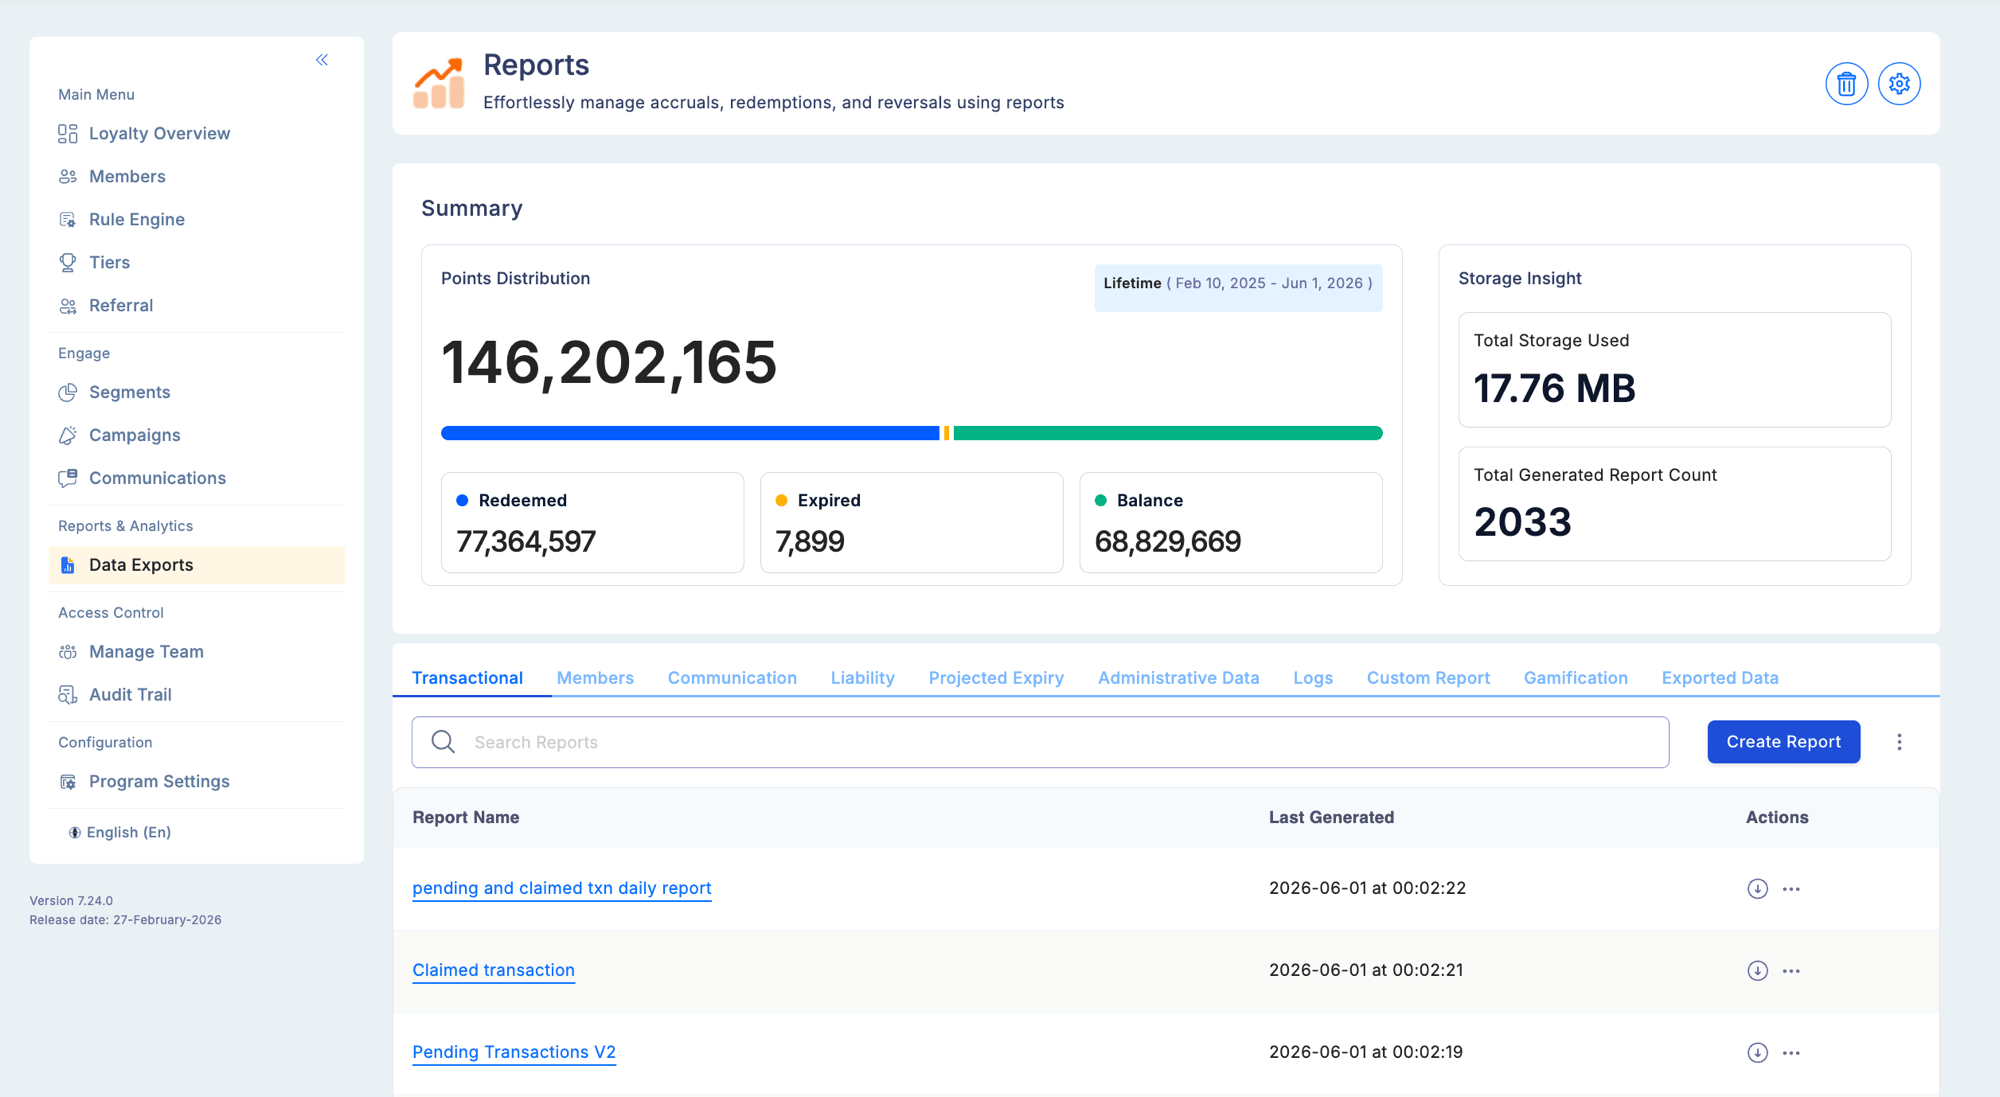
Reports are organised into eight categories, accessible as tabs under **Data Exports**:
| Category | What it covers |
| ----------------------- | ----------------------------------------------------------------------- |
| **Transaction** | Point accruals, redemptions, reversals — every earn and debit event |
| **Member** | Enrolment trends, balance snapshots, activity patterns |
| **Communication** | Email and SMS delivery, open rates, campaign engagement |
| **Projected Expiry** | Upcoming points expirations by month — for liability planning |
| **Liability** | Total outstanding unredeemed points — your current financial obligation |
| **Administrative Data** | Audit trail, user activity logs, configuration change history |
| **Logs** | File upload processing status, errors, and rejected records |
| **Custom Reports** | SQL-based reports with real-time preview and on-demand generation |
See [Report types](/user-guides/reports/report-types) for a detailed breakdown of each category.
See [Custom reports](/user-guides/reports/custom-reports) for SQL query reports, real-time preview, and custom date range generation.
## Report categories
Reports are organised into eight categories, accessible as tabs under **Data Exports**:
| Category | What it covers |
| ----------------------- | ----------------------------------------------------------------------- |
| **Transaction** | Point accruals, redemptions, reversals — every earn and debit event |
| **Member** | Enrolment trends, balance snapshots, activity patterns |
| **Communication** | Email and SMS delivery, open rates, campaign engagement |
| **Projected Expiry** | Upcoming points expirations by month — for liability planning |
| **Liability** | Total outstanding unredeemed points — your current financial obligation |
| **Administrative Data** | Audit trail, user activity logs, configuration change history |
| **Logs** | File upload processing status, errors, and rejected records |
| **Custom Reports** | SQL-based reports with real-time preview and on-demand generation |
See [Report types](/user-guides/reports/report-types) for a detailed breakdown of each category.
See [Custom reports](/user-guides/reports/custom-reports) for SQL query reports, real-time preview, and custom date range generation.
 ## What you can do
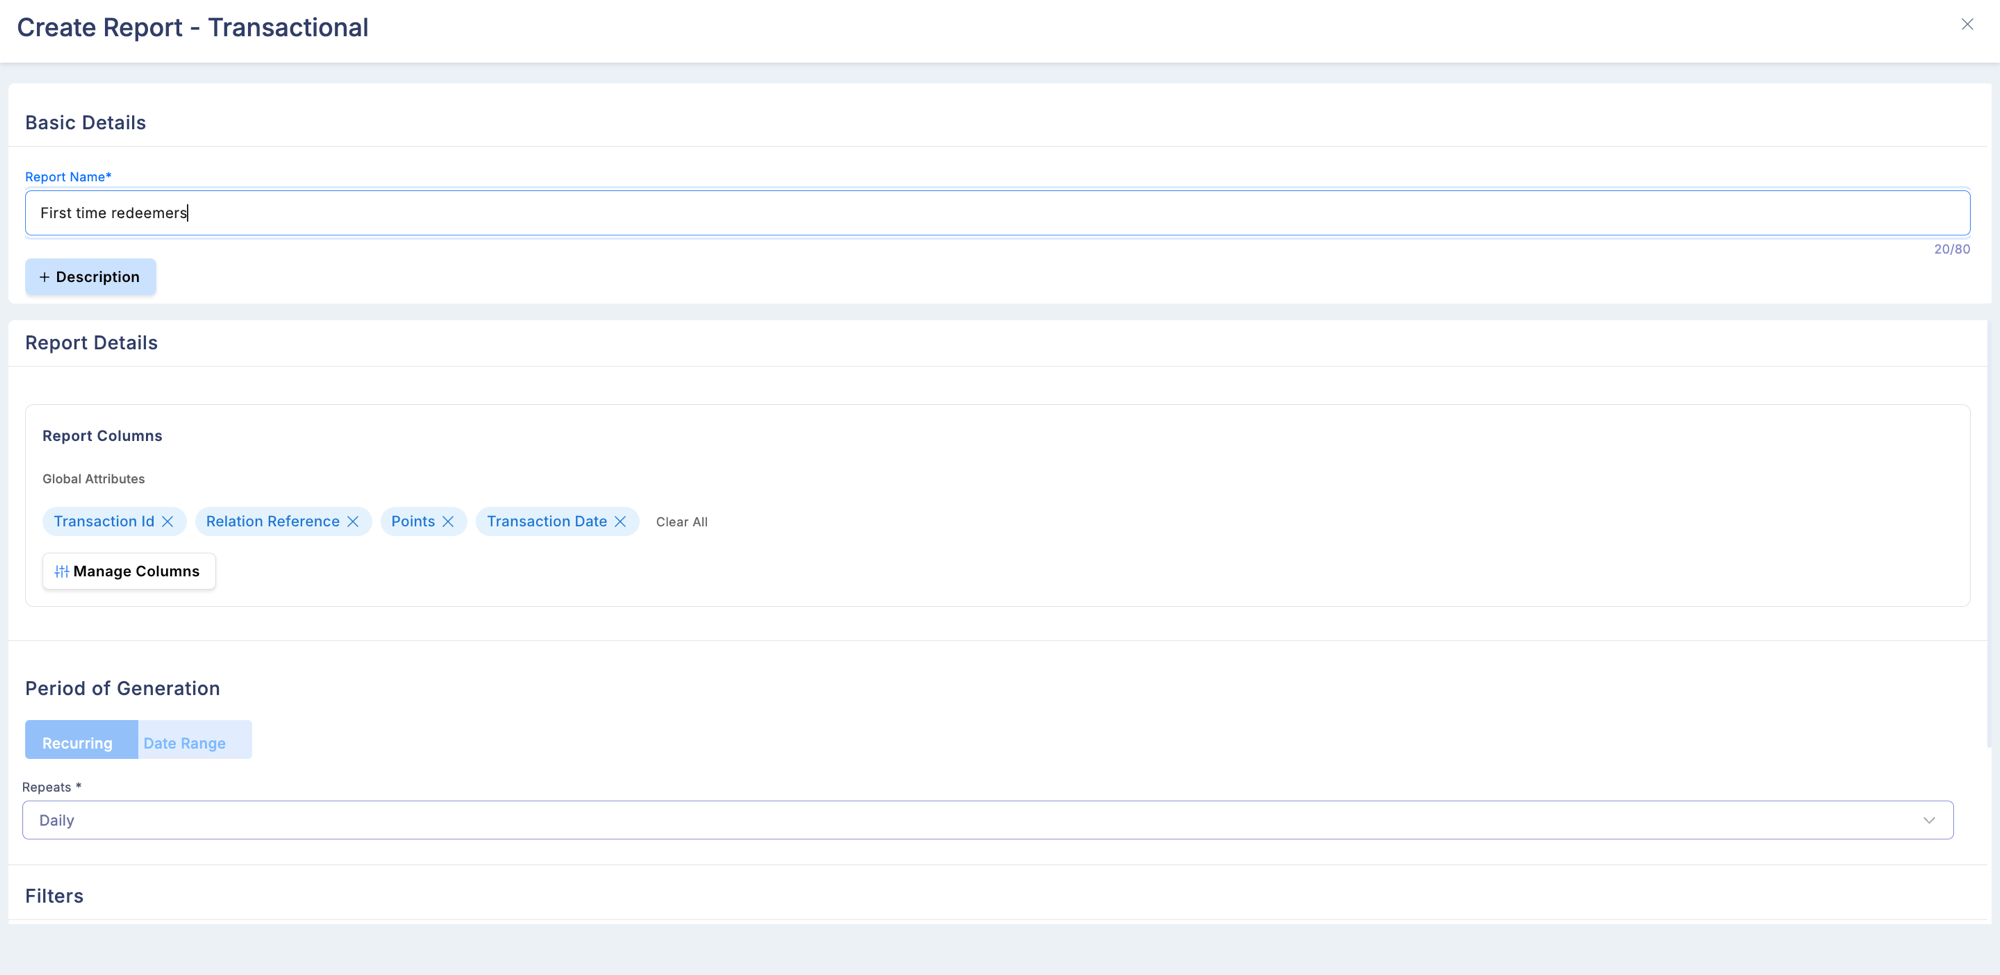
* **View in real time** — preview report data directly in the dashboard without downloading a file (available for standard and custom reports)
* **Schedule exports** — configure daily, weekly, or monthly automatic generation
* **Download on demand** — generate and download a report for any supported date range
* **Configure columns** — show only the columns relevant to your role; preferences persist across sessions
* **Share reports** — custom reports can be shared with specific users or roles
## Dashboards
The Dashboards view provides visual summaries of program performance:
| Dashboard | Key metrics |
| --------------------- | ---------------------------------------------------------- |
| Member dashboard | Total enrolled, active vs inactive, new enrolments trend |
| Transaction dashboard | Points issued, redeemed, expired — volume and trend charts |
| Engagement dashboard | Campaign participation rates, communication open rates |
Dashboards refresh automatically and do not require a manual download to stay current.
## Column customisation
Every standard report table supports **Configure Columns**. You can:
* Add optional columns to the display
* Hide columns not relevant to your view
* Preferences are saved per user and persist across sessions
* Default (mandatory) columns cannot be removed
## Scheduled reports
For recurring needs, configure a report to auto-generate:
| Schedule | Frequency |
| -------- | ------------------------ |
| Daily | Generates every day |
| Weekly | Generates once per week |
| Monthly | Generates once per month |
Scheduled outputs appear in the report's output list alongside any manual downloads, tagged by generation type.
## Permissions
| Action | Required permission |
| --------------------- | ------------------------------------------------------------------- |
| View reports | View Reports |
| Download reports | Download Reports |
| Create custom reports | Create Custom Reports (Super Admin) |
| View audit trail | View Audit Trail |
| Export member PI data | PI Data Access (requires separate toggle in Advanced Configuration) |
Use **Projected Expiry** and **Liability** reports together for financial planning. Expiry reports show when points leave the ledger; Liability reports show your current total obligation. Together they give you a forward-looking view of redemption pressure.
## What you can do
* **View in real time** — preview report data directly in the dashboard without downloading a file (available for standard and custom reports)
* **Schedule exports** — configure daily, weekly, or monthly automatic generation
* **Download on demand** — generate and download a report for any supported date range
* **Configure columns** — show only the columns relevant to your role; preferences persist across sessions
* **Share reports** — custom reports can be shared with specific users or roles
## Dashboards
The Dashboards view provides visual summaries of program performance:
| Dashboard | Key metrics |
| --------------------- | ---------------------------------------------------------- |
| Member dashboard | Total enrolled, active vs inactive, new enrolments trend |
| Transaction dashboard | Points issued, redeemed, expired — volume and trend charts |
| Engagement dashboard | Campaign participation rates, communication open rates |
Dashboards refresh automatically and do not require a manual download to stay current.
## Column customisation
Every standard report table supports **Configure Columns**. You can:
* Add optional columns to the display
* Hide columns not relevant to your view
* Preferences are saved per user and persist across sessions
* Default (mandatory) columns cannot be removed
## Scheduled reports
For recurring needs, configure a report to auto-generate:
| Schedule | Frequency |
| -------- | ------------------------ |
| Daily | Generates every day |
| Weekly | Generates once per week |
| Monthly | Generates once per month |
Scheduled outputs appear in the report's output list alongside any manual downloads, tagged by generation type.
## Permissions
| Action | Required permission |
| --------------------- | ------------------------------------------------------------------- |
| View reports | View Reports |
| Download reports | Download Reports |
| Create custom reports | Create Custom Reports (Super Admin) |
| View audit trail | View Audit Trail |
| Export member PI data | PI Data Access (requires separate toggle in Advanced Configuration) |
Use **Projected Expiry** and **Liability** reports together for financial planning. Expiry reports show when points leave the ledger; Liability reports show your current total obligation. Together they give you a forward-looking view of redemption pressure.