> ## Documentation Index
> Fetch the complete documentation index at: https://help-loyalife.xoxoday.com/llms.txt
> Use this file to discover all available pages before exploring further.
# Visual dashboards
> See how Loyalife's Superset-powered dashboards surface mobile app usage, member behavior, and channel partner performance in real time.
Visual Dashboards are built on Apache Superset and provide rich, interactive analytics beyond the standard tabular reports. They are embedded directly inside the Loyalife admin portal — no separate login or navigation to an external tool is required.
## Accessing dashboards
Navigate to **Reports & Analytics → Dashboards** in the left sidebar. Dashboards are listed as cards. Click any card to open the interactive dashboard embedded in the page.
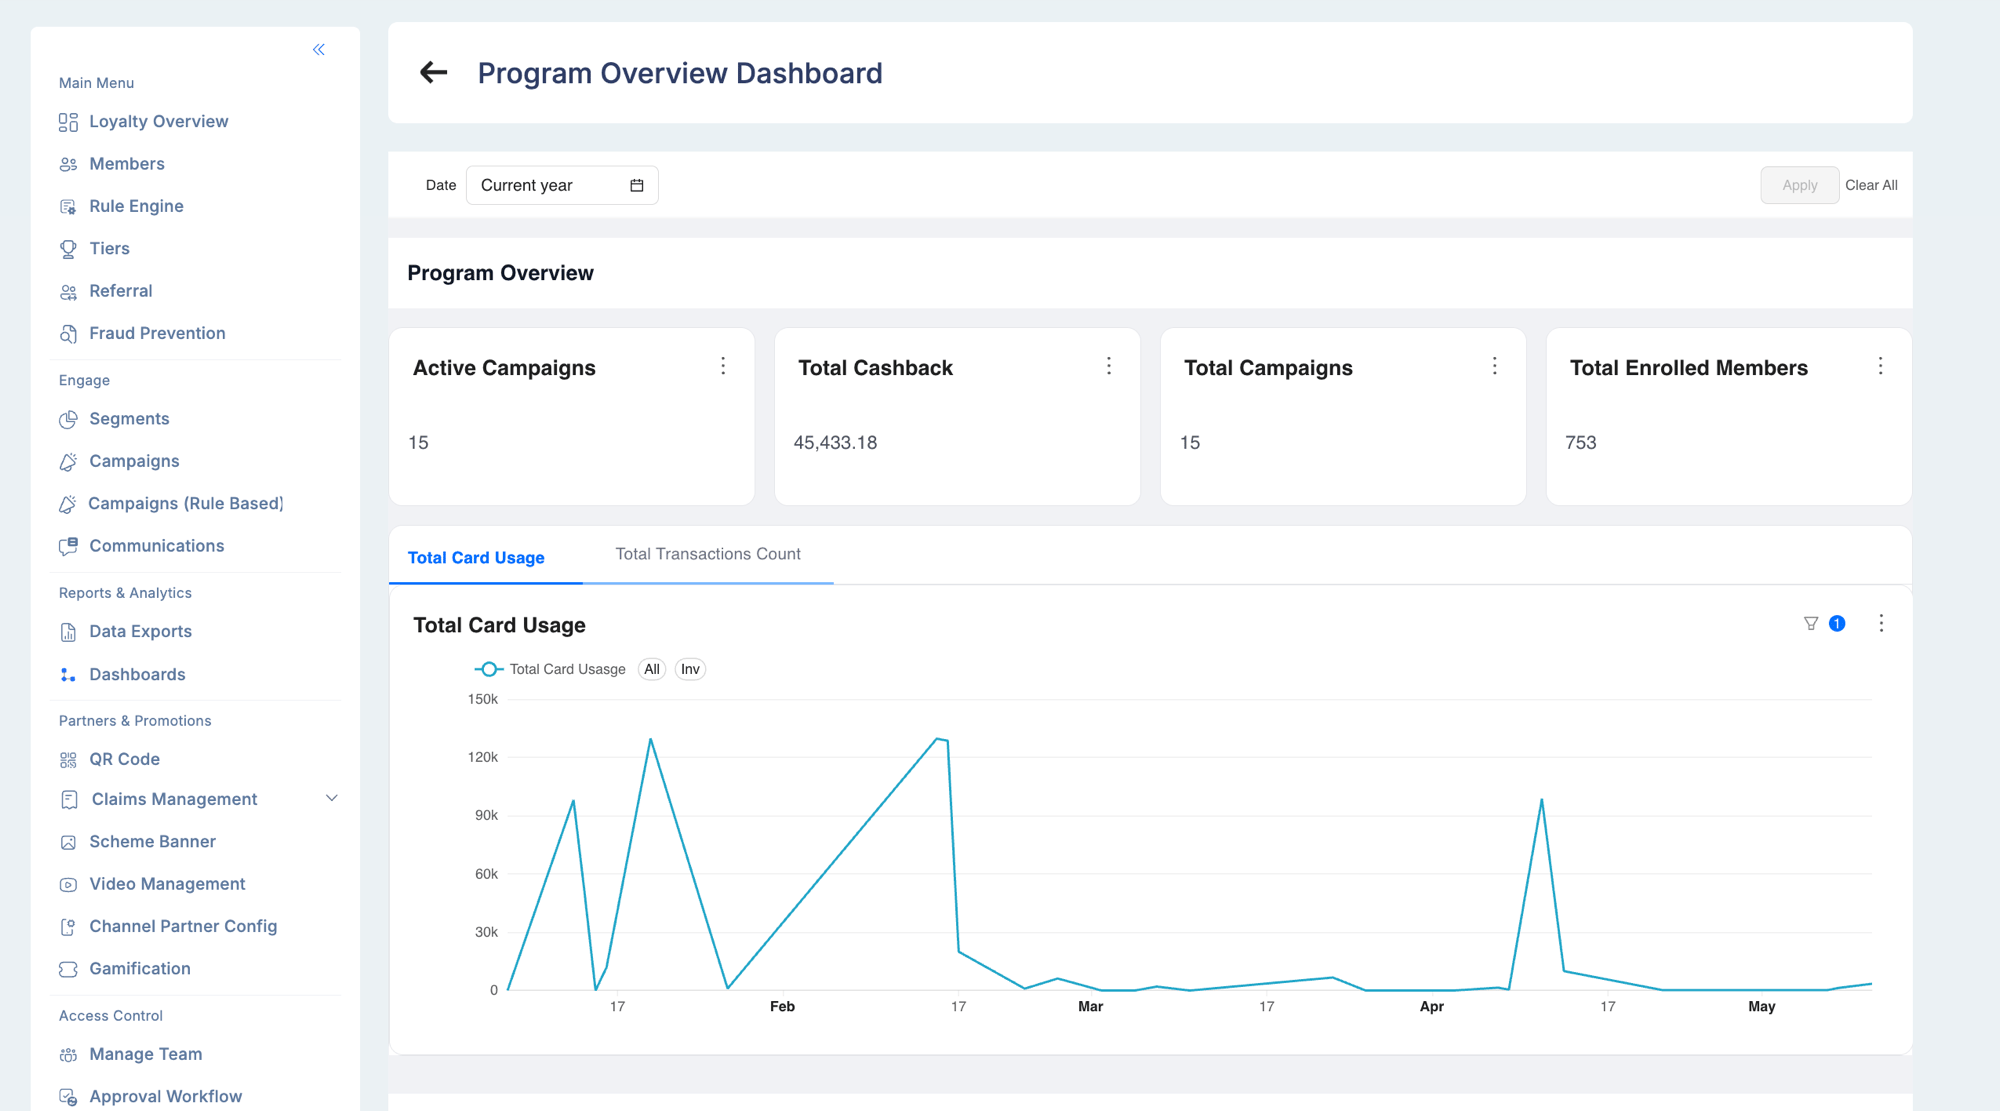 Access is permission-controlled. The `superset` permission on a user's role determines whether the Dashboards menu item is visible. Contact your Loyalife administrator to enable access.
## Pinning a dashboard to the overview
Frequently used dashboards can be pinned to the **Loyalty Overview** home screen so they load immediately when you log in. To pin a dashboard, open it and use the pin option from the dashboard menu.
## Data sources
Dashboards pull from two pipelines:
| Source | Data | Refresh cadence |
| ------------------------------------- | ----------------------------------------------------------------- | ------------------ |
| **Firebase Analytics** (via BigQuery) | Mobile app usage — DAU, sessions, new users, geographic breakdown | Daily sync at 2 AM |
| **Loyalife transaction database** | Points earned, redeemed, invoices uploaded, claims approved | Near real-time |
Dashboards are automatically filtered to the currently selected program — the program ID is passed at embed time, so you only see data for your program without any manual filtering.
### Firebase Analytics pipeline
Firebase events from all client mobile apps (Android, iOS, Web) flow into a shared BigQuery dataset. A nightly pipeline maps each app (`bundle_id + platform`) to its Loyalife program and writes results to the analytics database Superset queries.
The pipeline supports:
* **Per-program breakdown** — data is separated by bundle ID and platform
* **Gap recovery** — if a day is missed, the pipeline automatically backfills all missing dates on the next run
* **Manual backfill** — administrators can trigger a backfill for a specific date without disrupting the regular schedule
## Available dashboards
### Mobile app usage
| Metric | Description |
| ---------------------------- | ------------------------------------------------------------ |
| **DAU** (Daily Active Users) | Unique users who opened the app at least once on a given day |
| **Sessions** | Total app sessions |
| **New users** | Users who launched the app for the first time that day |
| **Country / city** | Geographic breakdown of usage |
Available per program, per platform (Android, iOS, Web), and per time range.
### Channel partner dashboards
For programs with channel partners:
| Dashboard | What it shows |
| ------------------------------- | ----------------------------------------------------------------------------- |
| **Invoice uploads by retailer** | Volume and trend of invoice submissions per partner |
| **Earned points by retailer** | Points credited per partner — identifies top performers and inactive partners |
### Program performance
* Points issued vs. redeemed over time
* Member tier distribution
* Redemption category breakdown
* Acquisition source split (referral vs. organic)
## Interacting with dashboards
### Filters
Every dashboard includes a filter bar. Common filters:
| Filter | Description |
| -------------- | ------------------------------------------------ |
| **Date range** | Adjusts the time window for all charts |
| **Platform** | Android, iOS, or Web (for mobile app dashboards) |
| **Partner** | Filters to a specific channel partner |
Click **Apply filters** after making selections. Filters persist within your session.
### Drill-down
Most charts are interactive — click a bar, segment, or data point to drill into detail. For example, clicking a country on the DAU map opens a city-level breakdown.
### Exporting data
1. Hover over a chart
2. Click the **⋮** menu
3. Select **Export to CSV** or **Download PNG**
For full dashboard exports, use the **PDF** option from the dashboard-level menu.
## Troubleshooting
**Dashboard shows no data for recent days.**
* The Firebase pipeline runs at 2 AM. Yesterday's data is available after that run completes.
* If data is missing for more than one day, the pipeline may have failed. Contact your Loyalife administrator to trigger a manual backfill.
**A program's data is not appearing.**
* The program may not have Firebase Analytics configured for its app. Confirm with your technical team that `analytics_sync_config` includes the program's bundle IDs.
**Dashboards menu is not visible.**
* Your role may not have the `superset` permission. Ask your Loyalife administrator to enable dashboard access for your role.
Access is permission-controlled. The `superset` permission on a user's role determines whether the Dashboards menu item is visible. Contact your Loyalife administrator to enable access.
## Pinning a dashboard to the overview
Frequently used dashboards can be pinned to the **Loyalty Overview** home screen so they load immediately when you log in. To pin a dashboard, open it and use the pin option from the dashboard menu.
## Data sources
Dashboards pull from two pipelines:
| Source | Data | Refresh cadence |
| ------------------------------------- | ----------------------------------------------------------------- | ------------------ |
| **Firebase Analytics** (via BigQuery) | Mobile app usage — DAU, sessions, new users, geographic breakdown | Daily sync at 2 AM |
| **Loyalife transaction database** | Points earned, redeemed, invoices uploaded, claims approved | Near real-time |
Dashboards are automatically filtered to the currently selected program — the program ID is passed at embed time, so you only see data for your program without any manual filtering.
### Firebase Analytics pipeline
Firebase events from all client mobile apps (Android, iOS, Web) flow into a shared BigQuery dataset. A nightly pipeline maps each app (`bundle_id + platform`) to its Loyalife program and writes results to the analytics database Superset queries.
The pipeline supports:
* **Per-program breakdown** — data is separated by bundle ID and platform
* **Gap recovery** — if a day is missed, the pipeline automatically backfills all missing dates on the next run
* **Manual backfill** — administrators can trigger a backfill for a specific date without disrupting the regular schedule
## Available dashboards
### Mobile app usage
| Metric | Description |
| ---------------------------- | ------------------------------------------------------------ |
| **DAU** (Daily Active Users) | Unique users who opened the app at least once on a given day |
| **Sessions** | Total app sessions |
| **New users** | Users who launched the app for the first time that day |
| **Country / city** | Geographic breakdown of usage |
Available per program, per platform (Android, iOS, Web), and per time range.
### Channel partner dashboards
For programs with channel partners:
| Dashboard | What it shows |
| ------------------------------- | ----------------------------------------------------------------------------- |
| **Invoice uploads by retailer** | Volume and trend of invoice submissions per partner |
| **Earned points by retailer** | Points credited per partner — identifies top performers and inactive partners |
### Program performance
* Points issued vs. redeemed over time
* Member tier distribution
* Redemption category breakdown
* Acquisition source split (referral vs. organic)
## Interacting with dashboards
### Filters
Every dashboard includes a filter bar. Common filters:
| Filter | Description |
| -------------- | ------------------------------------------------ |
| **Date range** | Adjusts the time window for all charts |
| **Platform** | Android, iOS, or Web (for mobile app dashboards) |
| **Partner** | Filters to a specific channel partner |
Click **Apply filters** after making selections. Filters persist within your session.
### Drill-down
Most charts are interactive — click a bar, segment, or data point to drill into detail. For example, clicking a country on the DAU map opens a city-level breakdown.
### Exporting data
1. Hover over a chart
2. Click the **⋮** menu
3. Select **Export to CSV** or **Download PNG**
For full dashboard exports, use the **PDF** option from the dashboard-level menu.
## Troubleshooting
**Dashboard shows no data for recent days.**
* The Firebase pipeline runs at 2 AM. Yesterday's data is available after that run completes.
* If data is missing for more than one day, the pipeline may have failed. Contact your Loyalife administrator to trigger a manual backfill.
**A program's data is not appearing.**
* The program may not have Firebase Analytics configured for its app. Confirm with your technical team that `analytics_sync_config` includes the program's bundle IDs.
**Dashboards menu is not visible.**
* Your role may not have the `superset` permission. Ask your Loyalife administrator to enable dashboard access for your role.