Accessing dashboards
Navigate to Reports & Analytics → Dashboards in the left sidebar. Dashboards are listed as cards. Click any card to open the interactive dashboard embedded in the page.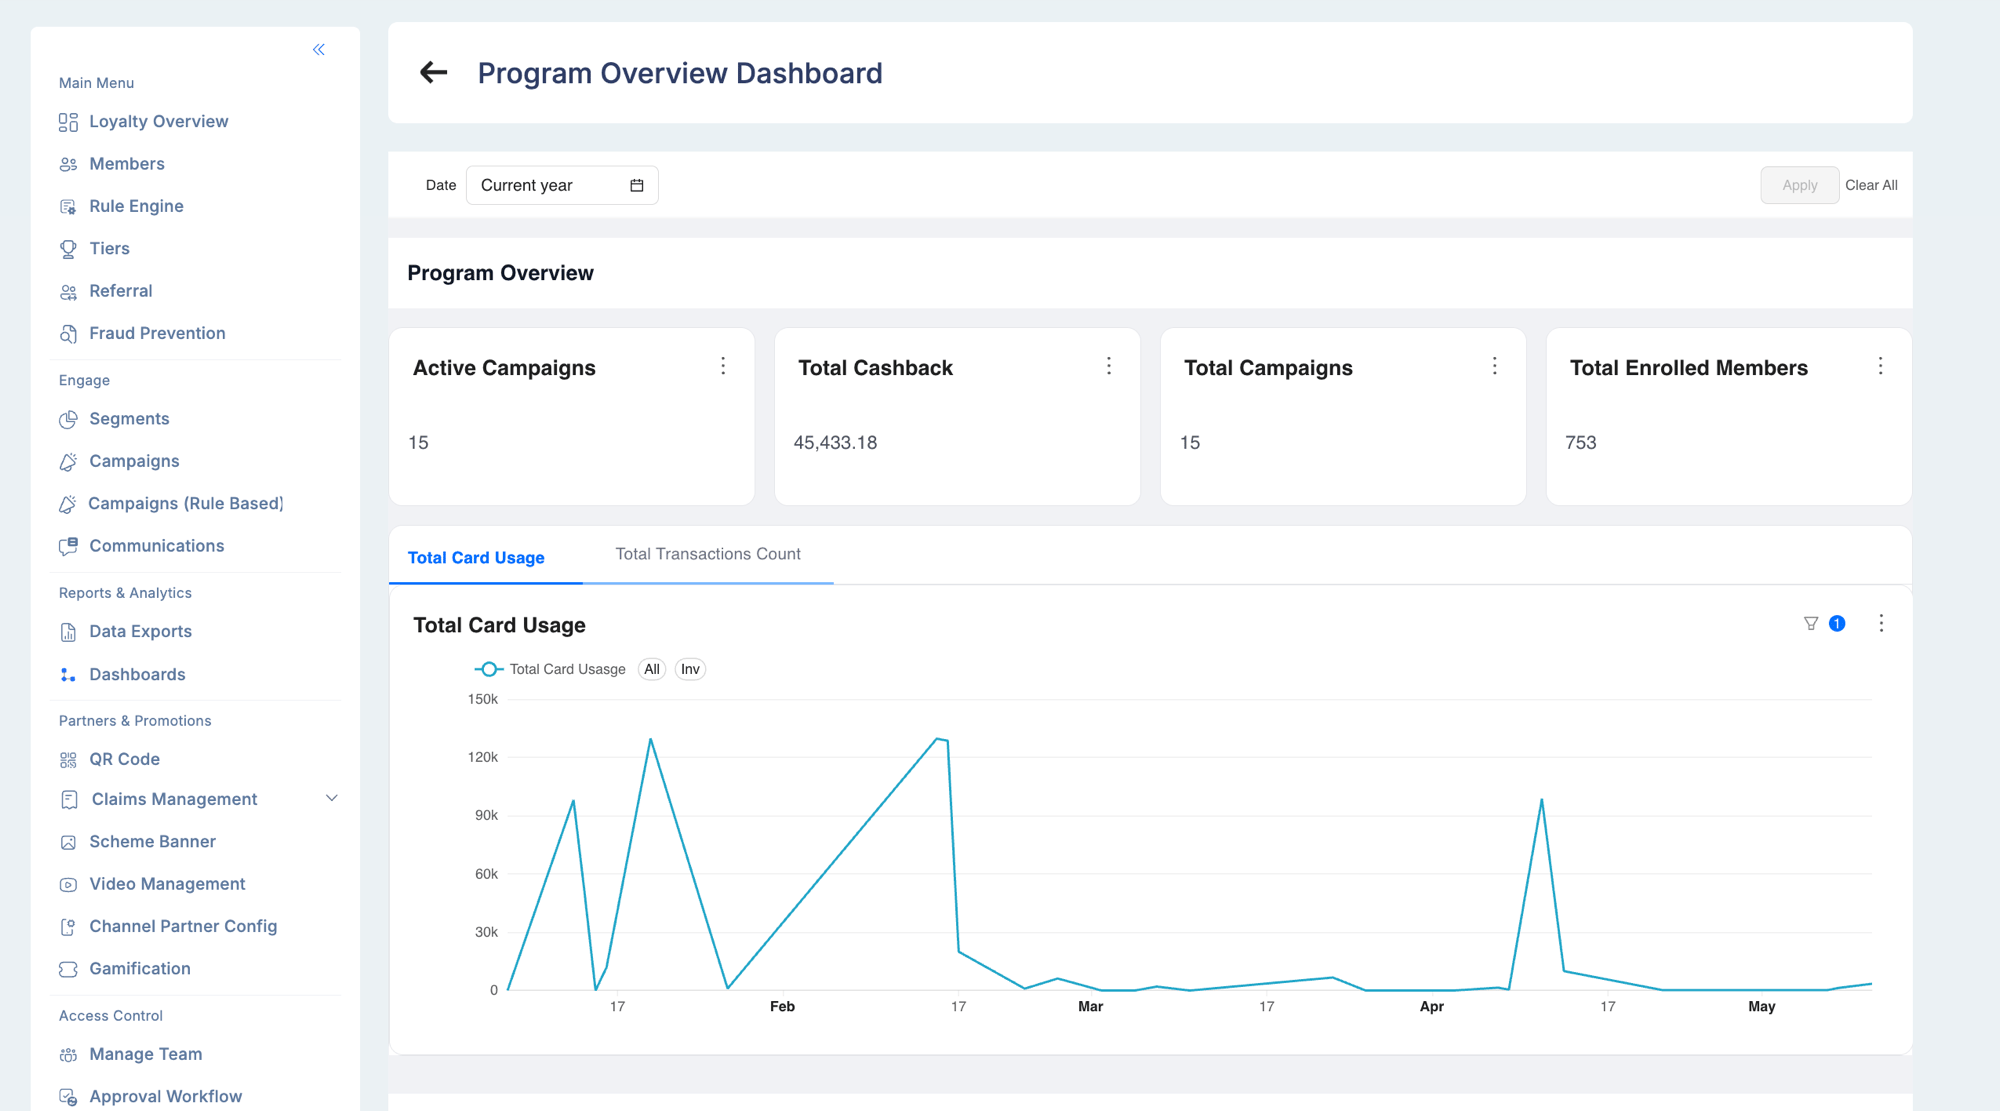
superset permission on a user’s role determines whether the Dashboards menu item is visible. Contact your Loyalife administrator to enable access.
Pinning a dashboard to the overview
Frequently used dashboards can be pinned to the Loyalty Overview home screen so they load immediately when you log in. To pin a dashboard, open it and use the pin option from the dashboard menu.Data sources
Dashboards pull from two pipelines:| Source | Data | Refresh cadence |
|---|---|---|
| Firebase Analytics (via BigQuery) | Mobile app usage — DAU, sessions, new users, geographic breakdown | Daily sync at 2 AM |
| Loyalife transaction database | Points earned, redeemed, invoices uploaded, claims approved | Near real-time |
Firebase Analytics pipeline
Firebase events from all client mobile apps (Android, iOS, Web) flow into a shared BigQuery dataset. A nightly pipeline maps each app (bundle_id + platform) to its Loyalife program and writes results to the analytics database Superset queries.
The pipeline supports:
- Per-program breakdown — data is separated by bundle ID and platform
- Gap recovery — if a day is missed, the pipeline automatically backfills all missing dates on the next run
- Manual backfill — administrators can trigger a backfill for a specific date without disrupting the regular schedule
Available dashboards
Mobile app usage
| Metric | Description |
|---|---|
| DAU (Daily Active Users) | Unique users who opened the app at least once on a given day |
| Sessions | Total app sessions |
| New users | Users who launched the app for the first time that day |
| Country / city | Geographic breakdown of usage |
Channel partner dashboards
For programs with channel partners:| Dashboard | What it shows |
|---|---|
| Invoice uploads by retailer | Volume and trend of invoice submissions per partner |
| Earned points by retailer | Points credited per partner — identifies top performers and inactive partners |
Program performance
- Points issued vs. redeemed over time
- Member tier distribution
- Redemption category breakdown
- Acquisition source split (referral vs. organic)
Interacting with dashboards
Filters
Every dashboard includes a filter bar. Common filters:| Filter | Description |
|---|---|
| Date range | Adjusts the time window for all charts |
| Platform | Android, iOS, or Web (for mobile app dashboards) |
| Partner | Filters to a specific channel partner |
Drill-down
Most charts are interactive — click a bar, segment, or data point to drill into detail. For example, clicking a country on the DAU map opens a city-level breakdown.Exporting data
- Hover over a chart
- Click the ⋮ menu
- Select Export to CSV or Download PNG
Troubleshooting
Dashboard shows no data for recent days.- The Firebase pipeline runs at 2 AM. Yesterday’s data is available after that run completes.
- If data is missing for more than one day, the pipeline may have failed. Contact your Loyalife administrator to trigger a manual backfill.
- The program may not have Firebase Analytics configured for its app. Confirm with your technical team that
analytics_sync_configincludes the program’s bundle IDs.
- Your role may not have the
supersetpermission. Ask your Loyalife administrator to enable dashboard access for your role.